•
Drizz raises $2.7M in seed funding •
•
Featured on Forbes
•
Drizz raises $2.7M in seed funding •
•
Featured on Forbes


Every mobile animation runs against a 16.67-millisecond budget per frame. The operating system asks renderer for a new frame every 16.67ms at 60Hz, or every 8.33ms on ProMotion and 120Hz Android displays. Any frame that takes longer is a dropped frame perceptible to user as jank. A 300ms drawer animation is roughly 18 frames app has to render on time; miss one and eye catches it. Miss five in a row on Android and ANR watchdog fires.
Animation defects are unusual in testing because they live in transitions rather than end states. A selector-based test that verifies "drawer is open" will pass whether drawer slid in smoothly, teleported into place, or jittered its way through a stuttering half-second. The bug is between frames, not at endpoints. That's why animation testing needs a different tool stack from rest of UI suite. In our production customer runs, roughly 12% of P1 UI defects live in animation layer jitter, wrong easing curves, interruption bugs and almost none of them are surfaced by selector-based tests alone.
Every animation bug we see falls into one of four categories. Each has a distinct symptom, a distinct testing approach, and a distinct set of tools that catches it.
Frame drops (jank). The most common defect. Any frame that takes longer than 16.67ms at 60Hz or 8.33ms at 120Hz causes a visible stutter. Frame drops usually cluster around expensive operations: layout inflation, image decoding on UI thread, large recomposition passes in Jetpack Compose, or unnecessary re-renders in React Native. The Android Profile GPU Rendering guide explains four-stage pipeline where this budget gets consumed.
Wrong end state. The animation completes but leaves UI in an unintended position. The drawer is half-open. The modal never fully dismisses. The tab indicator sits between two tabs. Bottom-sheet snap points miss their targets by 4-8 pixels. Selector-based tests miss this entirely because they check for element presence, not final position on screen.
Interruption bugs. The user taps mid-animation, gesture-scrolls during a transition, or backgrounds app before completion. Well-built physics-based animations retarget smoothly; spring animations arrest and re-simulate from current position. When they don't, you get instant jumps ("drawer teleports closed"), thread crashes on Android, or frozen UI states where subsequent taps are silently swallowed.
Performance impact. The animation is visually smooth but CPU spike it required starves rest of app. Network requests queue behind UI thread. Unrelated background work stalls. Battery drain climbs 3-4× above baseline during long-running or persistent animations. The animation ships as "smooth" but degrades everything else.
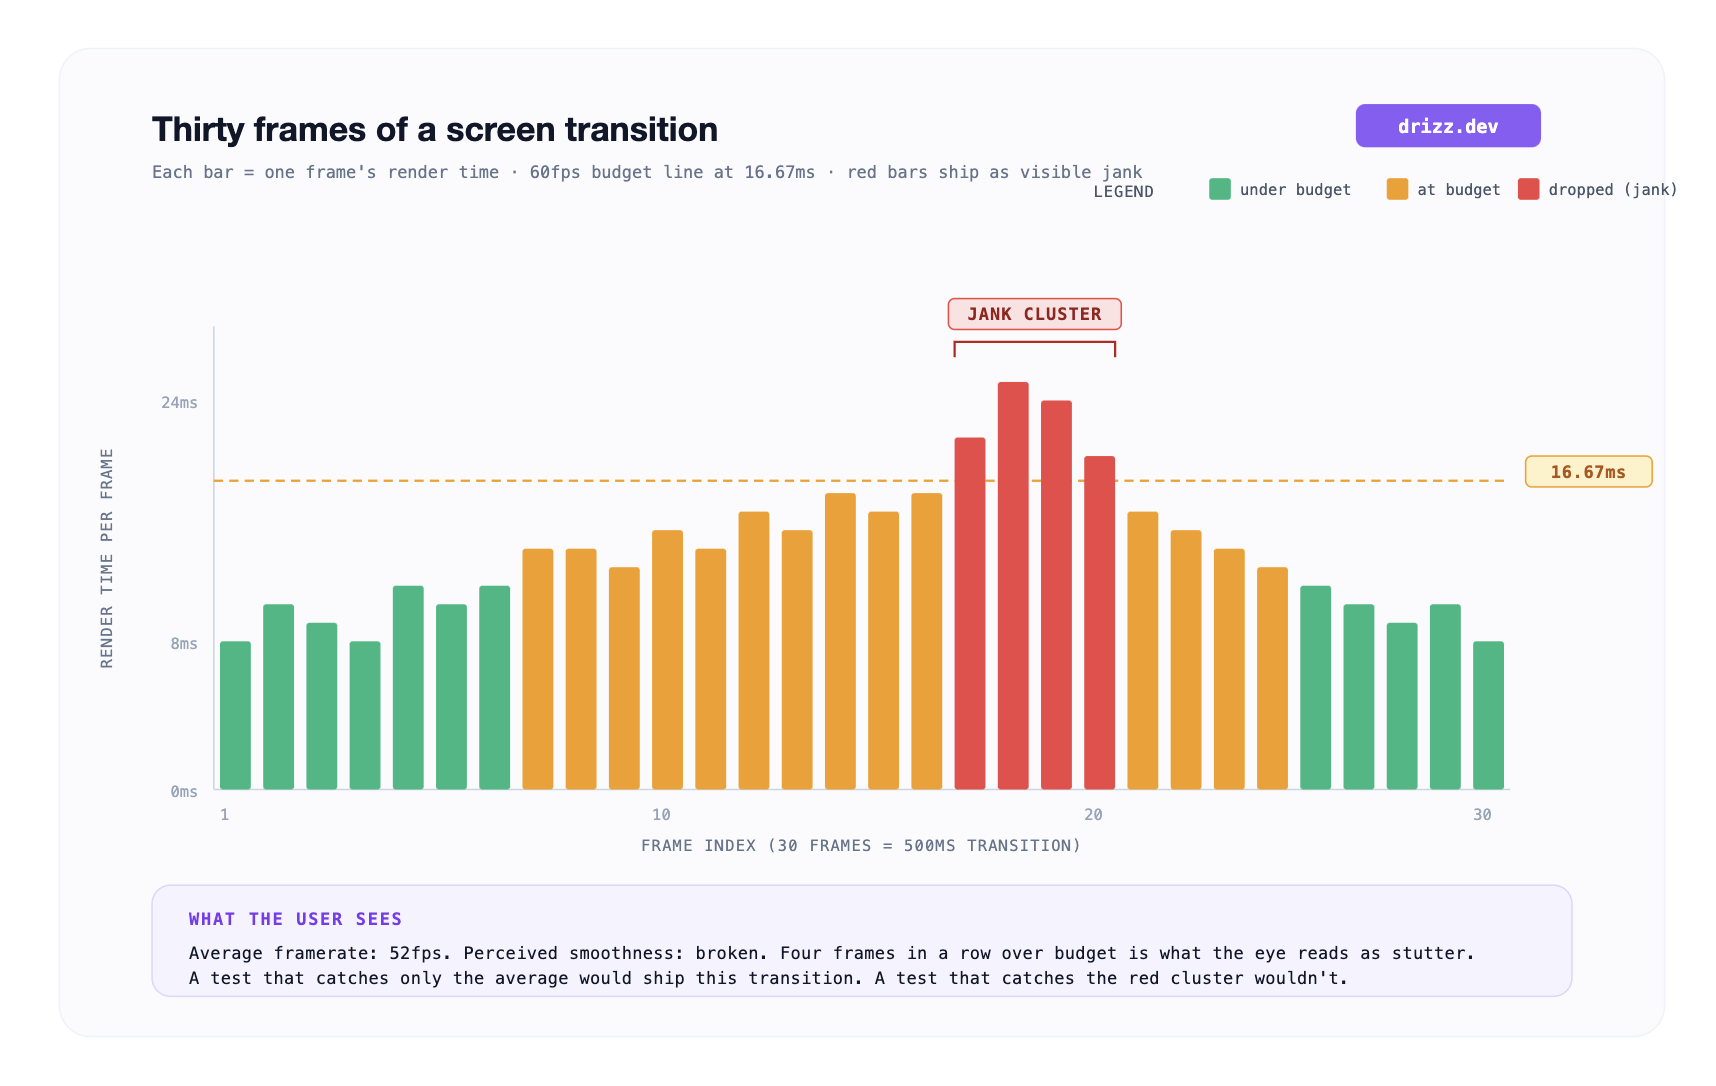
A 300ms transition is 18 frames at 60Hz. Four dropped frames in a row is what eye interprets as "animation stuttered." Perceived smoothness collapses long before overall framerate drops a single red bar in a critical position is more damaging than a lower steady framerate. Animation testing is about catching red bars in critical positions.
The categories map onto testing approaches almost cleanly. No single approach catches everything, which is why animation testing is one of few UI layers where multiple tools coexist in a healthy pipeline.
Which combination a team uses depends on animation's role in product. A payment confirmation animation gets full stack; a chevron rotation on a collapsible list may only need snapshot coverage.
Four tools cover meaningful range for mobile animation testing in 2026. Each catches a distinct subset of defect categories above, and a mature pipeline runs at least two of them in combination.
We built Drizz to test what a user actually sees, and animations are where that framing matters most. A selector-based test that checks "did drawer open" cannot distinguish a smooth slide from a jittery one; a snapshot test that compares end state cannot see what happened between frames. Our vision model reads rendered animation across its frame sequence and flags visual regressions same way a human tester would.
Four things we do specifically for animation regression that no other tool on this list does:
The underlying architecture is what we call Vision AI mobile testing layer where animation testing sits alongside layout and end-to-end regression coverage. Our production customer suites hold 5% flakiness on animation-heavy screens, against 8-15% baseline for selector-based tools we replace.
Best for: any team where animation layer carries brand or product weight payment confirmations, onboarding flows, delightful micro-interactions and where visual regressions in that layer would ship without automation catching them.
The platform-native profilers are reference for frame-drop detection. Android Studio's Compose animation tooling surfaces frame-by-frame inspection, and Xcode Instruments' Core Animation instrument tracks GPU render time to millisecond. Both are free, both are deep, and both are unmatched for what they measure.
The specific limit for animation regression: they're developer tools, not CI tools. An engineer runs profiler locally, catches a jank issue, and files it. They don't run automatically on every PR, and they don't fail a build when a regression lands. They also don't cover wrong-end-state or interruption bugs those live outside frame-timing pipeline. Teams typically use them for point-in-time investigation, not continuous regression coverage.
Best for: deep investigation of a known jank issue, performance-tuning work on a specific animation, or acceptance-testing a new animation before it ships. Not for continuous regression coverage.
The framework-native test hooks are closest coupling between animation runtime and assertion layer. Compose's mainClock.autoAdvance = false and Flutter's pumpAndSettle() let a test freeze animation time, step through frames, and assert on intermediate states. Fast, low-flake, in-repo, engineering-owned.
The specific limit for animation regression: they run inside framework's virtual clock, not on a real device with a real GPU. A test that passes against mainClock may still jank in production because CPU and GPU behavior on a real device isn't simulated in test runtime. They also can't catch OS-level interruption bugs (backgrounding, phone-call interrupts, low-memory kills). And they're platform-specific Compose tests don't cover iOS, and Flutter tests don't cover native Android outside Flutter widget tree.
Best for: unit-level animation assertions inside widget layer, where deterministic frame-stepping matters and CI pipeline runs headlessly.
Applitools' Visual AI compares rendered screenshots against a baseline library at any point in a test flow. For animation testing specifically, snapshots at start/mid/end frames catch wrong-end-state and visual glitch defects. Strong web coverage, mature diff engine.
The specific limit for animation regression on mobile: Applitools does not drive app. A test that snapshots mid-animation still needs Appium or an equivalent framework to open app, navigate to screen, trigger animation, and pause at right moment. Layering Applitools onto an existing Appium suite means you're maintaining both interaction layer (with selector-based flakiness that comes with it) and Applitools baseline library. Also, static snapshots at three points don't tell you what happened between them trajectory drift between start and end goes unmeasured.
Best for: teams already committed to Appium or WebDriver, where visual-diff supplements an existing test framework and static snapshots are enough signal.
The broader tool-selection framework for mobile testing sits in our mobile testing tool evaluation guide, which covers trade-offs across QA persona, code-first vs. no-code, and cloud vs. self-hosted device farms.

Animation testing catches motion regressions and frame-timing defects on app layer. Three categories stay outside its scope even in most mature pipelines:
Our read: motion regression coverage catches roughly 70-80% of defects that would otherwise ship as customer-facing jank, and it leaves perceived-quality and accessibility layers where they belong with human review and dedicated accessibility QA.
Selectors identify elements by ID, XPath, or accessibility label. All three properties are stable across animation button exists at frame 1, frame 18, and frame 30 whether animation stuttered or not. The bug is in pixel-level rendering between start and end states, which is not something a selector describes. A test that asserts "button is present after animation" will pass on a broken animation as long as button ends up where selector can find it.
60fps is floor for most mobile UI. Newer iOS devices with ProMotion and Android flagships with 90-144Hz refresh rates raise ceiling; a well-tuned animation runs at display's native rate when app has focus. In our production runs we alert when 3+ frames in a critical animation drop below target rate, not when average framerate is below target because eye sees clusters, not averages.
Real devices whenever possible. Emulators virtualize GPU and often over-report animation smoothness because host machine's CPU is doing work a phone would struggle with. The Android Emulator's Quick Boot mode also skips first-run compilation, which hides real-world jank on cold starts. On Drizz we run animation regression suites on a real-device cloud by default for exactly this reason.
Trigger animation, then tap another interactive element mid-animation, or send app to background via OS home button. Verify animation retargets, arrests, or resumes cleanly on foreground. Real-device tests catch this; framework virtual-clock tests miss OS-level state changes that trigger bug.
Layout testing verifies static screen composition do elements land in right positions, do labels fit, do containers overflow. Animation testing verifies transitions between layouts do elements move smoothly, do timings match design, do interruptions handle gracefully. The two layers are complementary; a healthy visual regression suite covers both. Our broader mobile testing coverage strategy covers where each fits alongside functional and end-to-end tests.





©Drizz 2026 • All Rights Reserved